Cloud bills surprise people in one of two ways: either a single line item quietly triples over a month and nobody notices until Finance asks about it, or a genuine incident (a runaway job, a misconfigured autoscaler) burns through budget in a day. Catching the second kind fast, and the first kind at all, both require the same underlying thing: a baseline for what "normal" spend looks like per service, per SKU, per team — and something that actually pages a human when today deviates from that baseline.
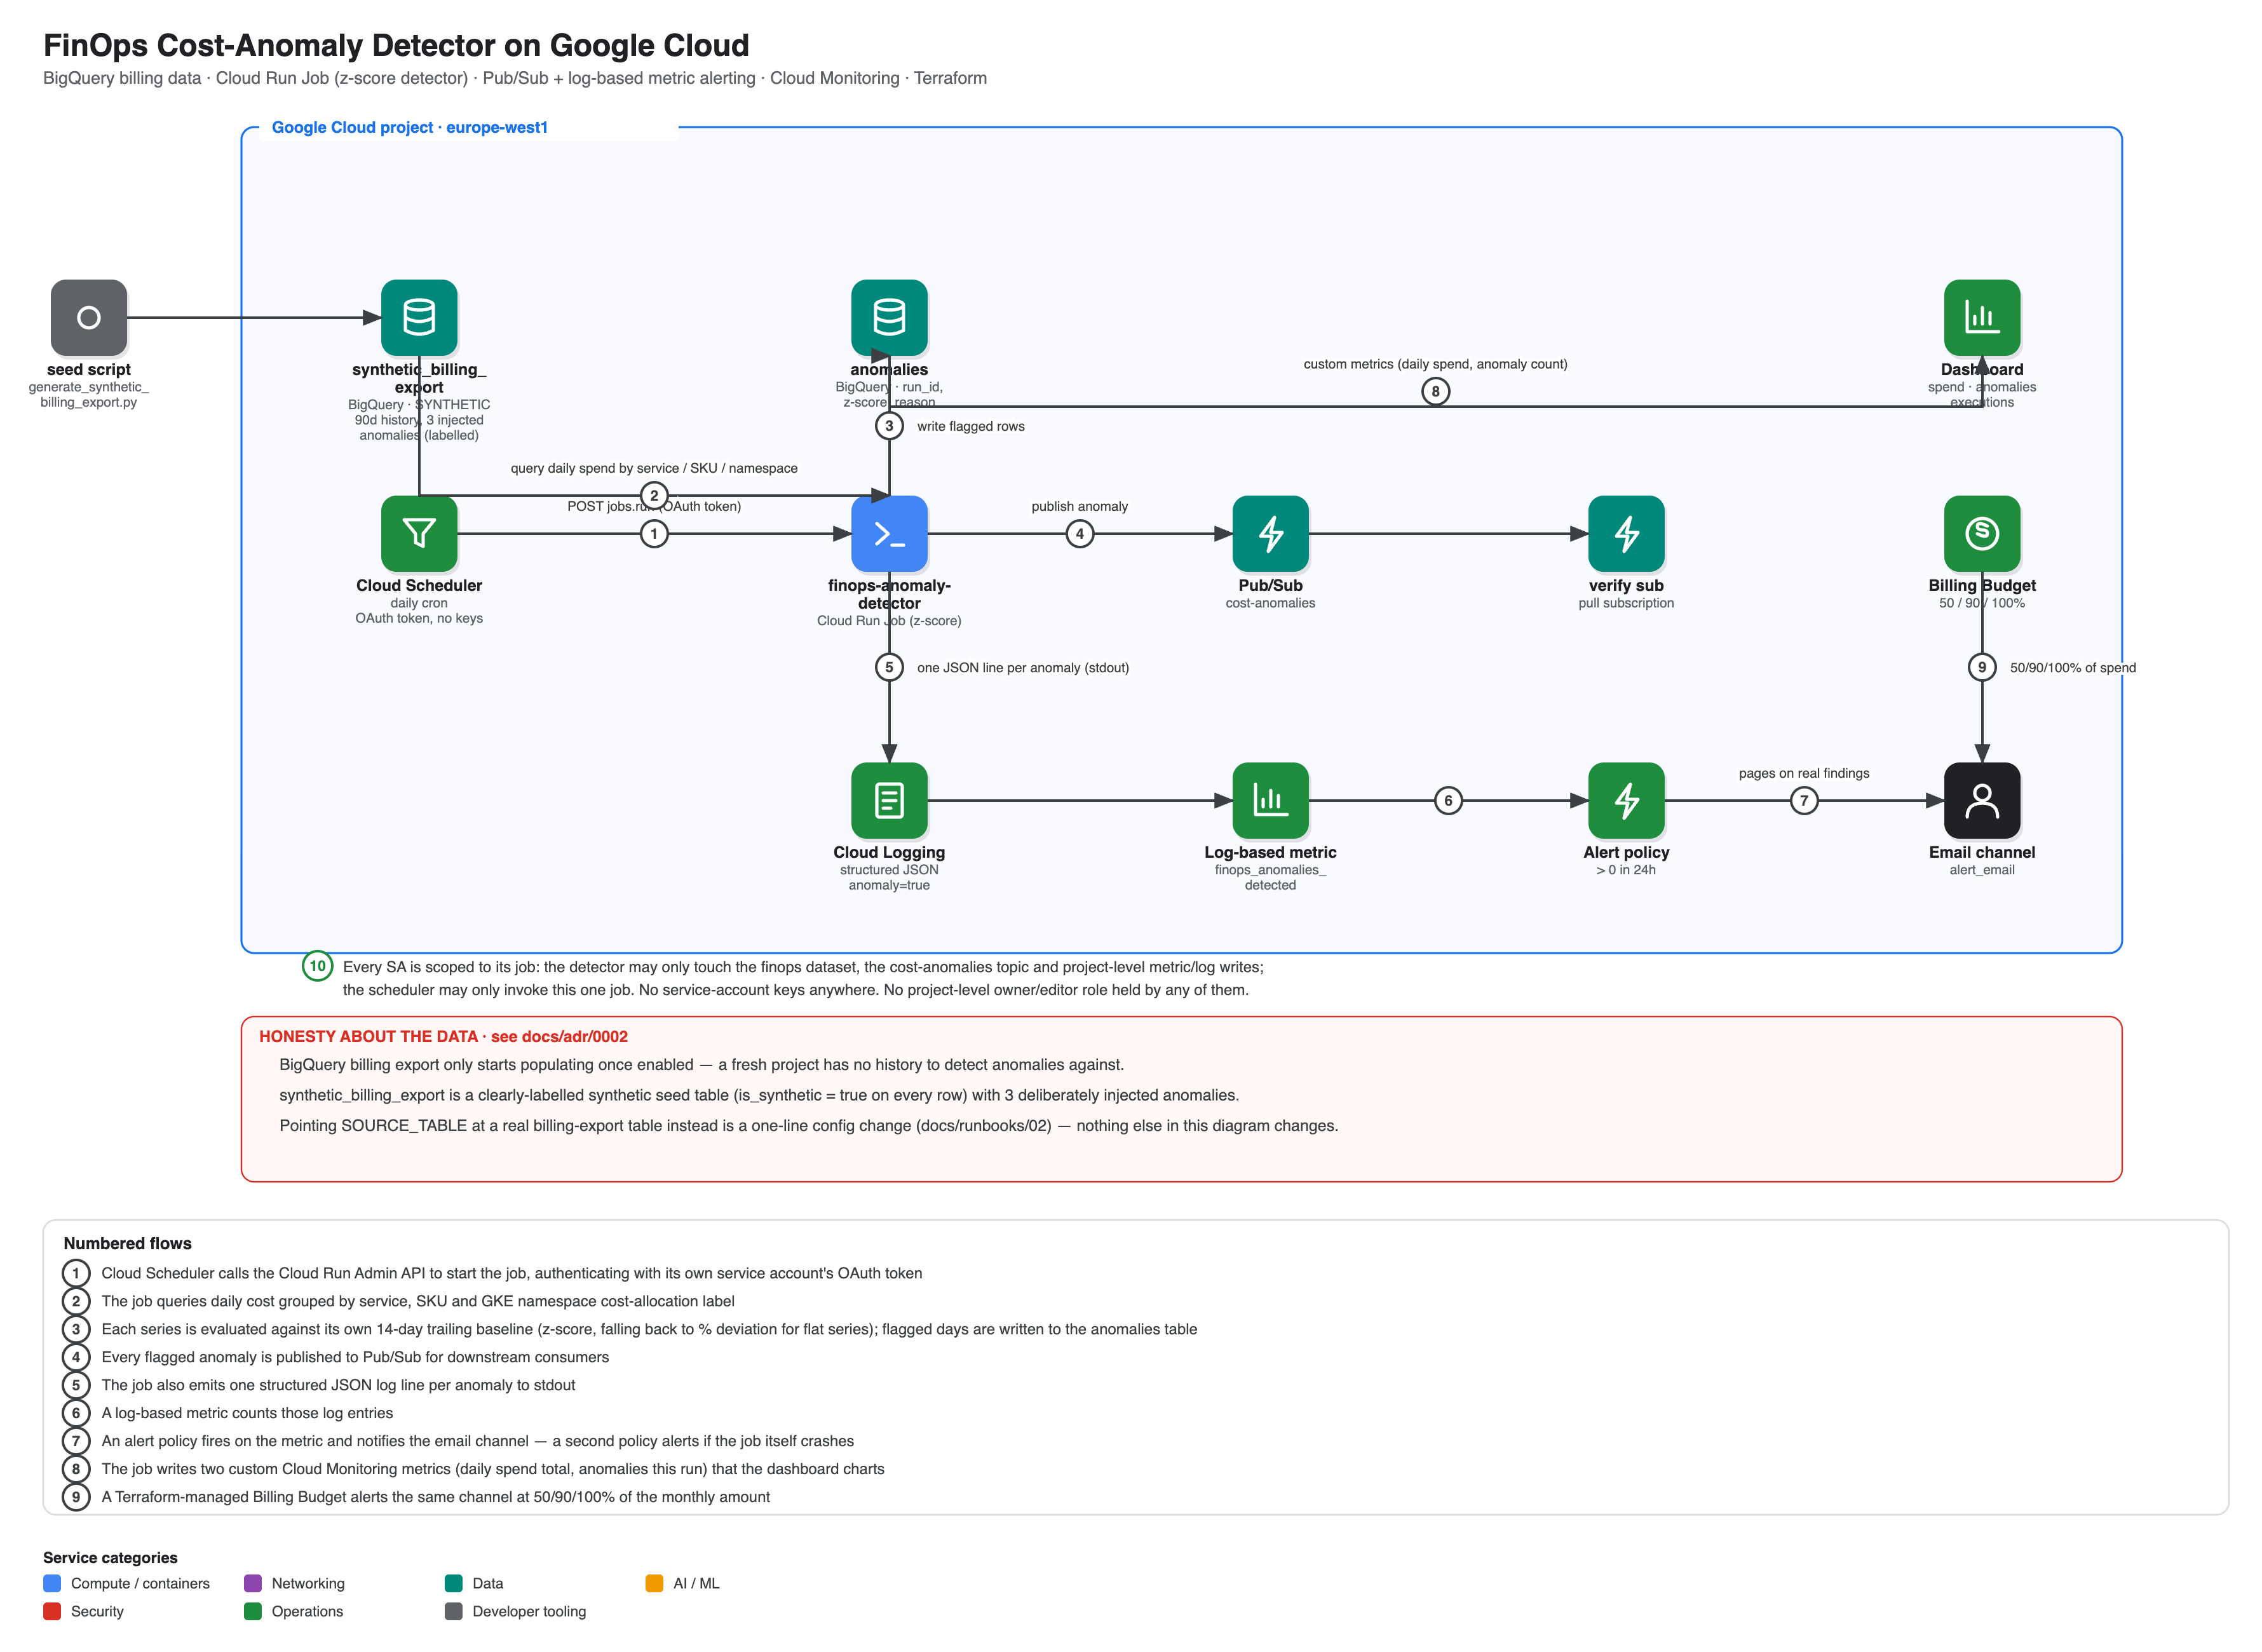
gcp-finops-cost-anomaly-detector is a scheduled Cloud Run Job that evaluates daily cost per service, SKU, and — the detail I think matters most here — GKE namespace cost-allocation label, against a 14-day trailing z-score baseline. Flagged days write to BigQuery, publish to Pub/Sub, and page through a Cloud Monitoring log-based-metric alert, with a Terraform-managed Billing Budget and dashboard running alongside. It deployed live in europe-west1, and its 21-check test suite passed 21 of 21 — including all three deliberately injected synthetic anomalies caught, with zero false positives.
Namespace-level cost allocation, not just per-service
Most FinOps tooling stops at "which GCP service is spending money" — Compute Engine, BigQuery, Cloud Run. That's necessary but not sufficient once you're running a shared GKE cluster across multiple teams, because "GKE spend went up" tells a platform team nothing about which team's workload caused it. This detector goes one level deeper, evaluating anomalies per GKE namespace cost-allocation label as well — so a spike traceable to team-b's namespace shows up as team-b's anomaly, not an undifferentiated "Kubernetes Engine" line that someone then has to manually investigate.
Handling day one honestly
A trailing 14-day z-score baseline has an obvious problem: on day one, there's no history to trail. Rather than either faking confidence or refusing to run until real data accumulates, the detector seeds a clearly labelled synthetic billing table — every row carries is_synthetic = true — that stands in for a real billing export until genuine history exists. The design decision here (documented in ADR 0002) is explicit about what this does and doesn't prove: it proves the detection method works correctly against known injected spikes, not that the system has caught a genuine, naturally occurring anomaly yet. The test suite enforces that the flag is never ambiguous — is_synthetic is asserted non-null on every row, so synthetic and real data can never silently blur together later.
test §4: 3 deliberately injected synthetic anomalies
  → 3/3 correctly flagged, 0 false positives, 0 missed
Findings that reach someone, and go somewhere
A structured log line becomes a log-based metric, which feeds a Cloud Monitoring alert policy that emails on detection — and a second, independent alert policy pages if the detector job itself crashes, which is a distinction worth having: "the detector found nothing" and "the detector didn't run" are very different failure modes and deserve different alerts. Every flagged anomaly is also published to Pub/Sub, which the live test verifies by pulling the message back out of a dedicated verification subscription — proving the integration point actually emits something a downstream system (Slack, a ticketing system) could consume, even though this build deliberately stops short of wiring one up.
Four decisions, honestly framed
| Decision | Trade-off |
|---|---|
| Cloud Run Job, not a Cloud Function or a long-running service | No built-in cross-invocation retry/backoff — reruns have to be idempotent by design |
| Clearly-labelled synthetic seed data for the baseline | Proves the method, not that it's caught a genuine anomaly yet |
| A log-based metric for paging, Pub/Sub for integration — two mechanisms, not one merged path | Two things to keep in sync instead of one |
| No GitHub-Actions Workload Identity Federation; CI is lint/validate/scan only | By design — CI never touches the live project, which is a smaller blast radius than a CI misconfiguration that could |
The bug that only a live run found
The first real deployment surfaced a genuine bug: the custom-metrics writer crashed the job after it had already written its detection results to BigQuery. Which means the detection worked, but the job's own exit status lied about it — a false failure signal that would have paged on-call for a run that actually succeeded. It's fixed and documented in runbook 04, and the from-scratch run this README's status line refers to already has the fix in place. It's a good example of why "the tests pass" and "the tests pass on a live rebuild from nothing" are different claims — the second one is what actually validates the fix stuck.
What this doesn't claim to be
Detection is proven against clean, synthetic, deliberately-injected spikes — not the genuinely noisy seasonality real production billing has (release-train weeks, month-end batch jobs, a Black-Friday-shaped traffic curve). There's no seasonality-aware model here, just a trailing z-score with a percentage-deviation fallback for flat series. There's no live webhook wired to Slack or a ticketing system — the Pub/Sub integration point exists and is proven, but deliberately isn't connected to anything for this build. No CMEK on the BigQuery dataset, no VPC Service Controls perimeter, single region, and no CI-driven live deploy, for the same "CI never touches the live project" reasoning as the alerting design.
Try it yourself
git clone https://github.com/soodrajesh/gcp-finops-cost-anomaly-detector
cd gcp-finops-cost-anomaly-detector
gcloud config set project <your-project>
./scripts/up.sh    # infra → seed synthetic billing data → build → job + scheduler → detect → live tests
./scripts/down.sh  # delete everything, including the BigQuery dataset and its data
Well under €0.10 for a full build-test-teardown session — a Cloud Run Job only bills while an execution runs, and BigQuery/Pub/Sub/Monitoring usage doesn't come close to their free tiers. A Terraform-managed Billing Budget bounds total spend regardless, which is a slightly amusing but deliberate detail: a cost-anomaly detector that itself has a hard spend ceiling.
📢 Have questions or feedback? Drop a comment below or connect with me on Twitter/X@spysood!