Most demo dashboards that claim to show SRE practice show the console tab where you clicked "create alert policy." That proves the policy exists, not that it works. The only way to know an alert actually fires when it should — and, just as importantly, actually clears when the problem is gone — is to break something on purpose and watch the whole loop close.
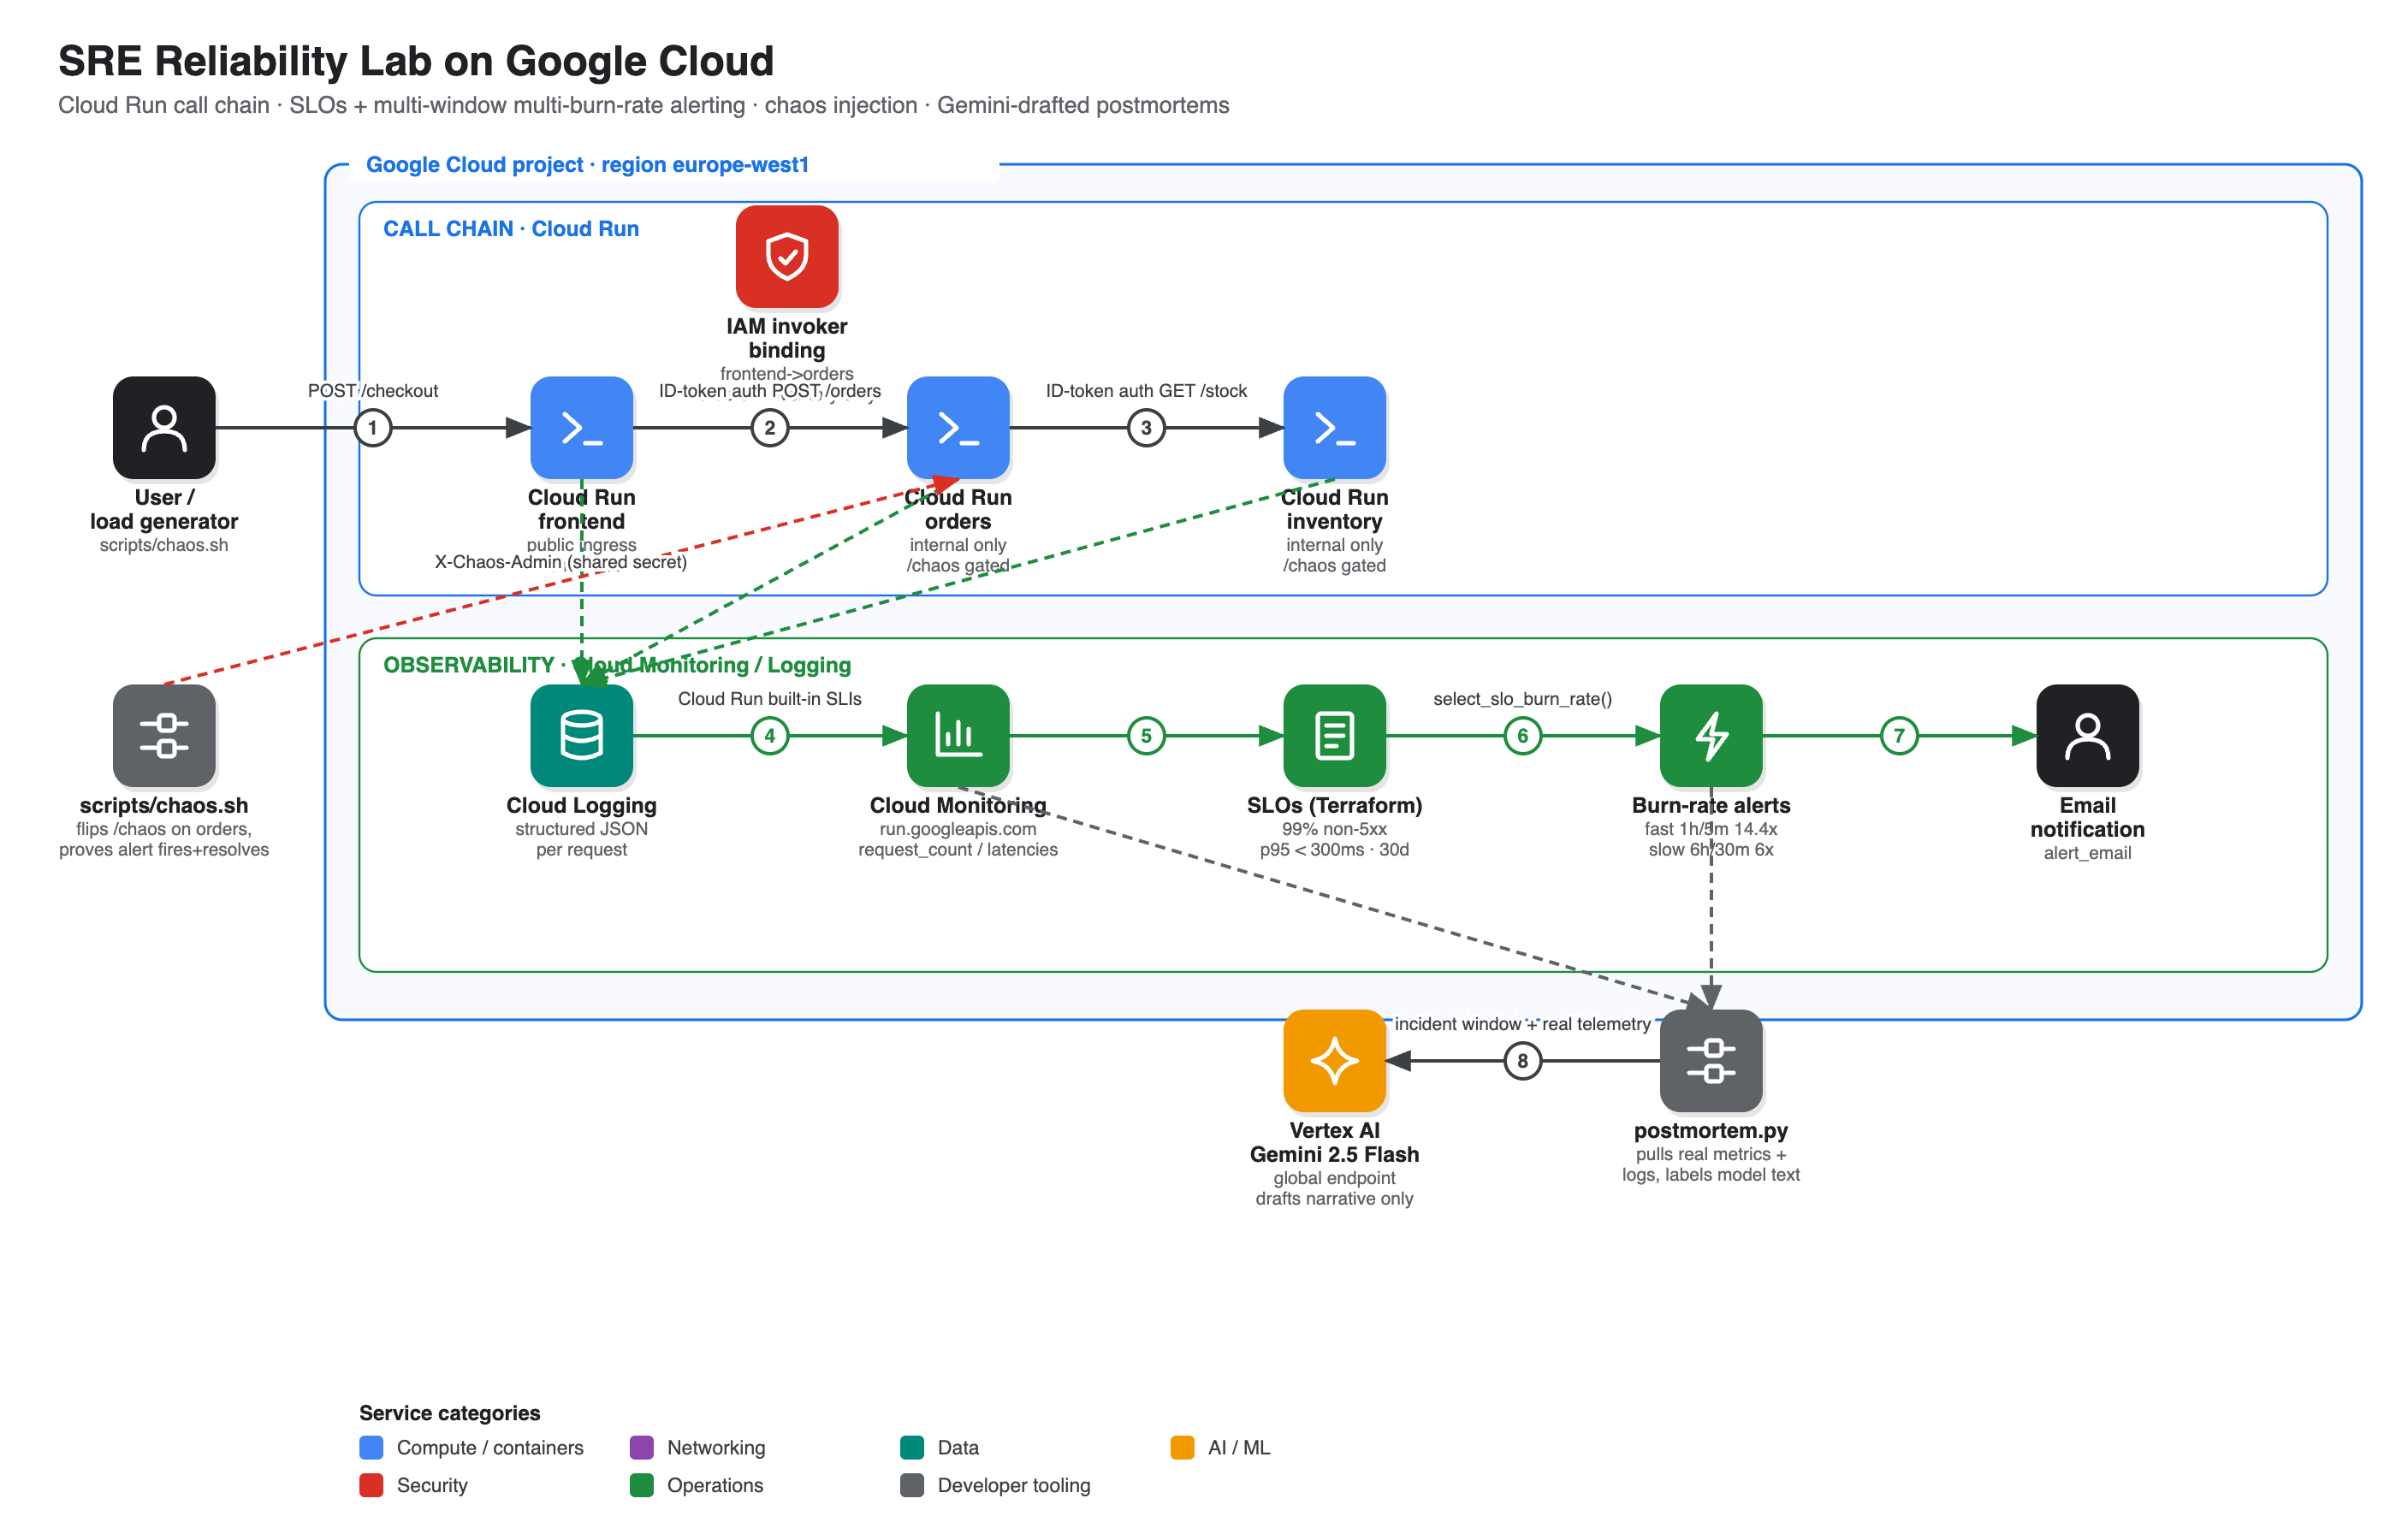
gcp-sre-reliability-lab is a small frontend → orders → inventory call chain on Cloud Run, instrumented the way a real SRE team would instrument it: SLOs defined as Terraform, alerting that follows the Google SRE Workbook's multi-window multi-burn-rate pattern rather than a single noisy threshold, a chaos endpoint gated behind IAM and a shared secret, and a script that drafts a postmortem from real Cloud Monitoring and Logging data once an incident is over. I ran the chaos drill for real — not a `sleep 5` stand-in — and watched the alert's actual query cross its threshold, then recover.
SLOs are Terraform, not console clicks
Each of the three services gets two SLOs, both reading Cloud Run's own built-in request_count and request_latencies metrics — no invented custom metrics, because Cloud Run already emits everything a request-based SLI needs once the service is parsing structured JSON logs. That's a deliberate simplification: the SLI should measure what users actually experience, and "did the request succeed, and how fast" is exactly what those two metrics already answer.
| Service | Availability SLO | Latency SLO |
|---|---|---|
| frontend | 99% non-5xx, 30d rolling | 95% < 300ms, 30d rolling |
| orders | 99% non-5xx, 30d rolling | 95% < 300ms, 30d rolling |
| inventory | 99% non-5xx, 30d rolling | 95% < 300ms, 30d rolling |
Multi-window multi-burn-rate, not a single threshold
A naive alert — "page me if the error rate exceeds 5% for 5 minutes" — has two failure modes at once: it's too twitchy for a genuinely noisy minute, and too slow for an error budget that's being consumed fast. The SRE Workbook's fix is to require two windows to agree: a long window that filters noise, and a short window that catches things fast, both evaluated against how quickly the error budget is actually burning.
Twelve alert policies come out of this — two burn speeds × two SLO types × three services — each one an AND of a long-window condition and a short-window condition against the same select_slo_burn_rate query:
fast burn:  1h window AND 5m window, both > 14.4x   (2% of a 30d budget in 1h)
slow burn:  6h window AND 30m window, both > 6x      (10% of a 30d budget in 6h)
A single bad minute can't trip either policy on its own — the short window has to agree with the long window before the condition fires, which is exactly the property that keeps this from paging someone over one flaky request.
The drill: burn a real error budget, not a fake one
The obvious way to fake this would be to hit the same select_slo_burn_rate API once, or trust the app's own claim that "chaos is on." Neither proves the alert policy itself would have fired — so instead scripts/chaos.sh injects a real 80% error rate on orders and keeps real load running against it, then samples the exact query, window, alignment and threshold the alert policy's own conditions use, repeatedly, for the duration.
09:47:43Z   Chaos injected on orders: error_rate=0.8
09:47–10:00 Both 1h and 5m burn-rate conditions sampled every ~90s,
            consistently above 14.4x simultaneously — peak ~50x/52x
09:52:12Z   Chaos flag cleared... on one Cloud Run instance
09:52–09:56 Other instances still armed — real 500s continue (confirmed in logs)
09:56:52Z   Clear request sent 25x to round-robin across every instance
10:02:19Z   5m burn-rate window rolls past the last real error → reads 0
            AND condition false → policy back to not-firing (re-confirmed 10:03:50Z)
The gap between 09:52 and 09:56 wasn't planned. This app's chaos flag lives in memory, per Cloud Run instance — a limitation the README already flagged honestly as a known gap before the drill ran. Under sustained load, Cloud Run had scaled orders to more than one instance, and my first "clear chaos" request only reached one of them; the others kept returning real 500s for another four minutes until enough repeated requests round-robined across all of them. That's the kind of thing a chaos drill is supposed to surface — a distributed-systems wrinkle a diagram would never show — so it's documented in the drill report rather than smoothed over.
One honesty note worth being explicit about: gcloud and the Monitoring API expose alert policy definitions, not a scriptable "list open incidents" endpoint for this policy type, and the configured notification email goes to an account outside this session's reach. So "fired" here means directly querying the same computation the alerting engine performs — same filter, same window, same threshold — and watching both conditions cross it together, repeatedly, not inferring it from one moved number.
A postmortem drafted from data, not from a prompt
scripts/postmortem.py pulls the real numbers first — request/error counts per minute from Cloud Monitoring, sample log lines from Cloud Logging — and only then hands them to Gemini 2.5 Flash to draft the narrative sections, under a heading that says exactly that. Run against the real 09:47:43Z–10:02:19Z window:
Total requests: 4,863
Total 5xx:      1,682
Error rate:     34.59%
Errors cease exactly at 09:58:00Z (0 of 316 requests)
The model's root-cause section correctly inferred the trigger from raw data alone — it noticed a cluster of chaos_updated log events setting error_rate back to 0.0 right before the error rate dropped, and flagged fault injection as the likely cause without being told that's what happened. It also flagged, accurately, that the log data alone doesn't show when the chaos injection began — a real gap in what a log-only postmortem can reconstruct, and a fair thing for the draft to say rather than paper over.
Ingress is not the access boundary — IAM is
orders and inventory are reachable over their public .run.app URLs (INGRESS_TRAFFIC_ALL), which sounds looser than it is. Cloud Run's INGRESS_TRAFFIC_INTERNAL_ONLY doesn't actually treat calls from another Cloud Run service as "internal" unless the caller has Direct VPC egress into the same VPC — a real, easy-to-miss gotcha that broke the call chain outright on first deploy. The fix is to stop relying on network ingress for access control at all: roles/run.invoker, scoped to frontend's exact service account, is the actual boundary. An unauthenticated direct call to orders gets a 403; a call routed through frontend succeeds. Ingress controls what can reach the service's front door; IAM controls who's allowed through it — treating the second as the real gate is the more honest model when the first one has a gap in it.
What's honestly missing
One project, one region — no multi-region failover story here. The SLIs are request-count and latency only; no saturation or queue-depth SLI, because Cloud Run's autoscaling already absorbs most of what those would catch at this scale. The chaos-admin token is a Terraform-generated environment variable, not Secret Manager — fine for a lab with a small blast radius, not the production answer. And the in-memory, per-instance chaos state that caused the four-minute clear delay above is a real limitation of this specific lab, not a claim about chaos engineering in general.
Try it yourself
git clone https://github.com/soodrajesh/gcp-sre-reliability-lab
cd gcp-sre-reliability-lab
gcloud config set project <your-project>
./scripts/up.sh                                # infra → 3 services → SLOs/alerts → chaos proof
./scripts/chaos.sh error 360                   # re-run the drill on demand
./scripts/postmortem.py --since <RFC3339> --until <RFC3339>
./scripts/down.sh                              # delete everything
Cloud Run scales to zero between drills, and Cloud Monitoring/Logging usage at this size sits inside the always-free tier — this whole build, test, chaos-drill, teardown cycle ran without leaving anything billable behind.
📢 Have questions or feedback? Drop a comment below or connect with me on Twitter/X@spysood!